An Arduino waveform generator is ideal for developing devices for TDR, line attenuation testing, fluid flow measurement, sensory detections, etc.
Developing the prototype is relatively easy compared to other projects because you only need three components.
- Programmable waveform generator
- Oscilloscope
- Arduino board
We will look at how you can expand the system later to include a seven-segment display. But let’s build the basic project first.
Table of Contents
- What Is a Waveform Generator?
- Arduino Waveform Generator Project
- Arduino Waveform Generator Improvement
- Wrap Up
What Is a Waveform Generator?
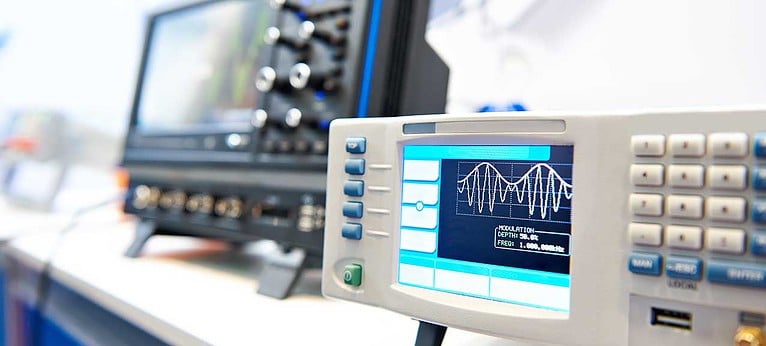
A waveform generator is a type of signal generator that creates single-shot or repetitive waveforms over a broad signal range.
Typical waveforms include sine, square, and triangular, but some can generate cardiac-pattern, arbitrary, and Gaussian pulse waves.
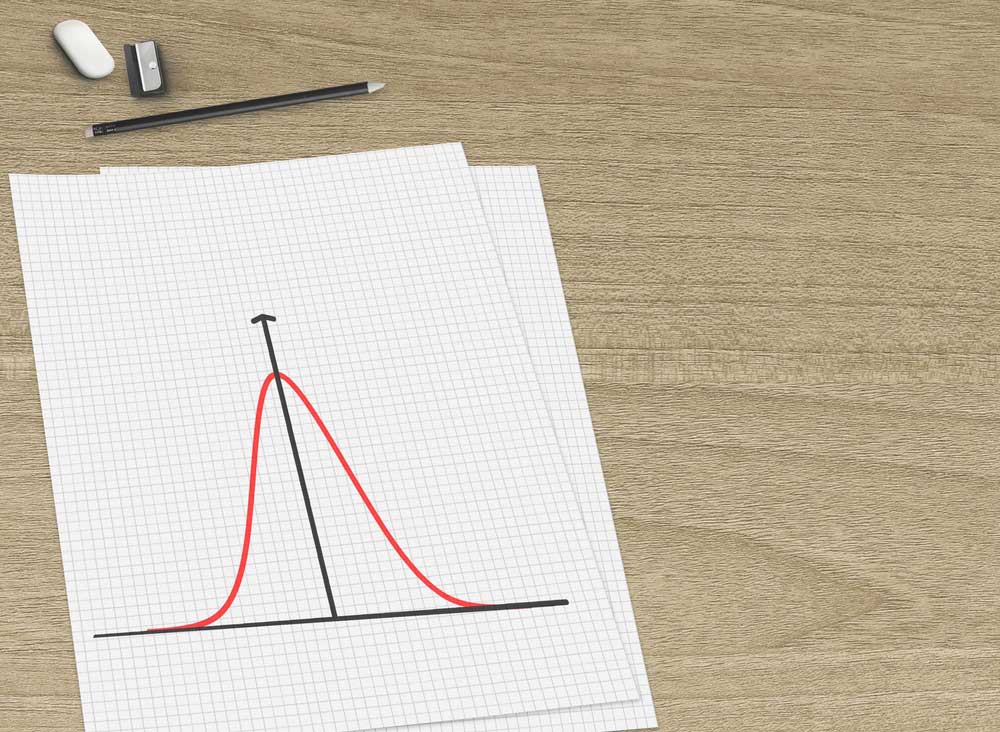
A Gaussian wave
Arduino Waveform Generator Project
We will use the AD9833 programmable waveform generator for this project.
This low-power generator can create sine, square, and triangular wave signals with frequencies 28 bits wide.
The frequency of these output waveforms can be up to 12.5 MHz.
This programmable unit can achieve a resolution of 0.1 Hz with a 25 MHz clock rate.
But you can tune this resolution to 0.004 Hz to achieve higher accuracy with a 1 Mhz clock rate.
Here’s how you interface the AD9833 to an oscilloscope and Arduino board.
You can use the Arduino UNO board or Mega, but we’ll run the project using the Nano.
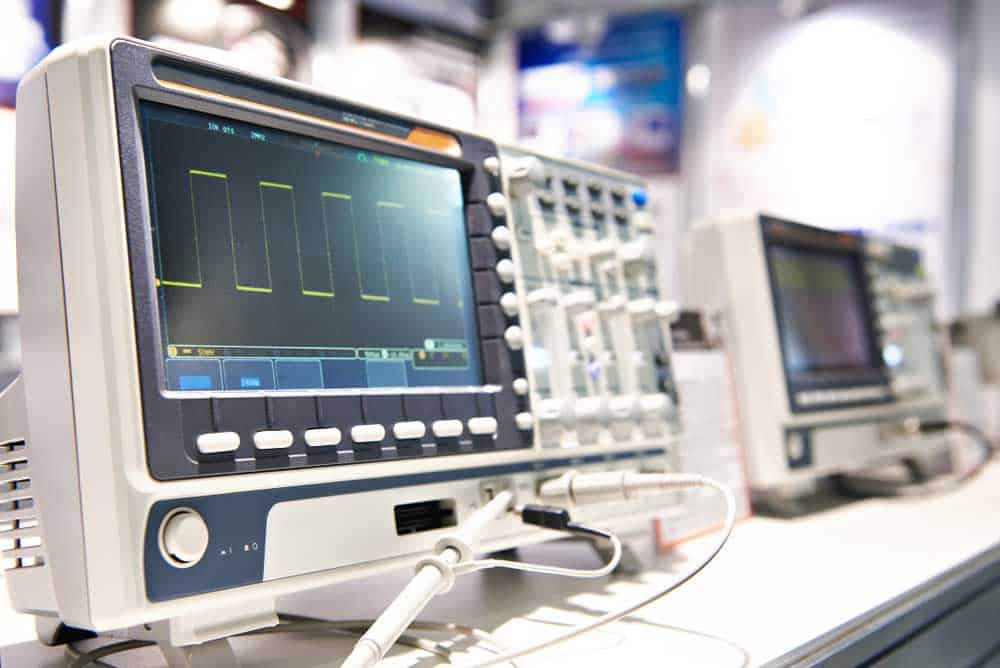
An oscilloscope (spectrum analyzer) displaying square waves
Hardware Connections
| Arduino Nano | AD9833 |
| 5V | Vcc |
| GND | DGND |
| D11 | SDATA |
| D13 | SCLK |
| D9 | FSYNC |
Circuit Diagram
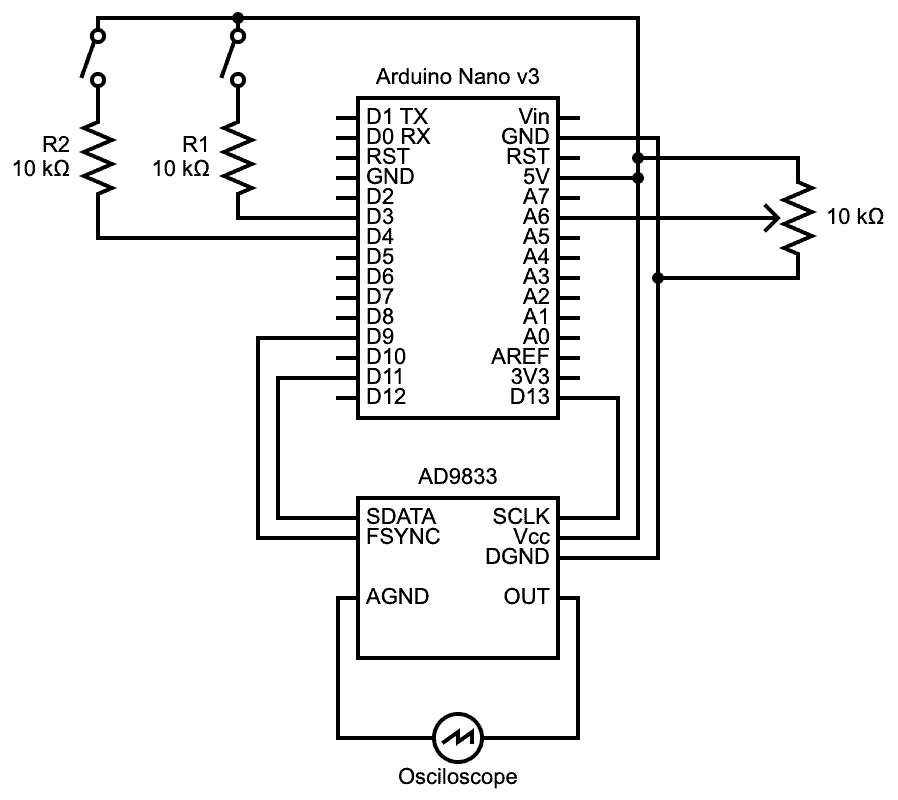
A simple Arduino waveform generator circuit diagram
The waveform generator module connects to the Arduino board using its SPI bus (SDATA, SCLK, and FSYNC).
SDATA connects to Arduino’s D11, the master-output-to-slave-input line.
On the other hand, SCLK connects to Arduino’s clock pin (D13), while FSYNC attaches to Arduino’s chip select terminal (D9).
There’s also a 10kΩ potentiometer to provide an analog signal to pin A6 to control the output waveform frequency.
And the AD9833 sends the output signal to the oscilloscope via its OUT pin.
Lastly, a 2-bit dip switch connects to the board’s pins D3 and D4 via two 10kΩ resistors. This setup creates a truth table where:
| Switch 1 | Switch 2 | Generated Waveform |
| 0 | 0 | Sine wave |
| 0 | 1 | Triangular wave |
| 1 | 0 | Square wave |
| 1 | 1 | Square wave but with half the frequency |
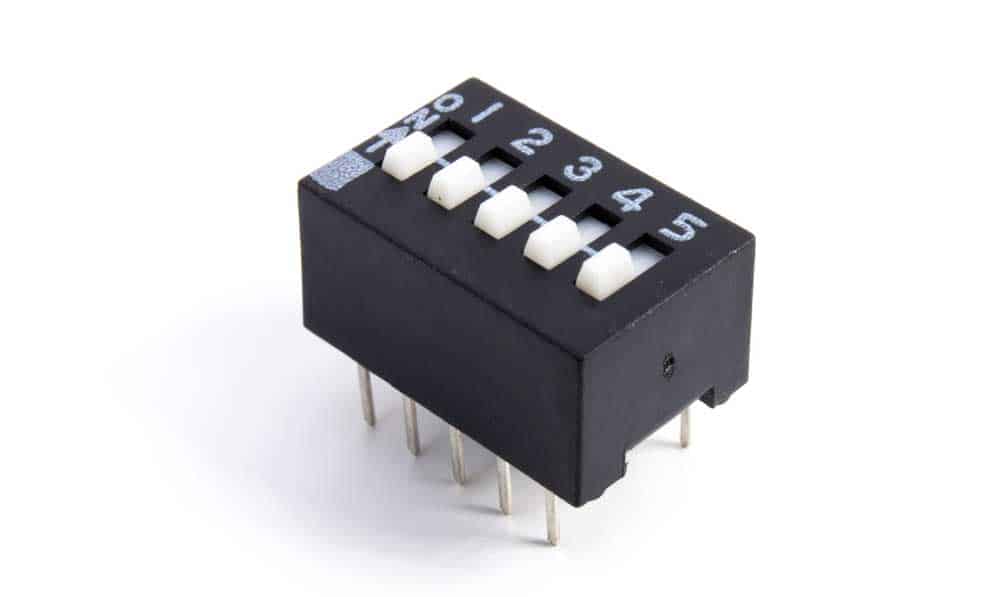
A 5-bit dip switch
Let’s implement this reasoning into Arduino code.
Code
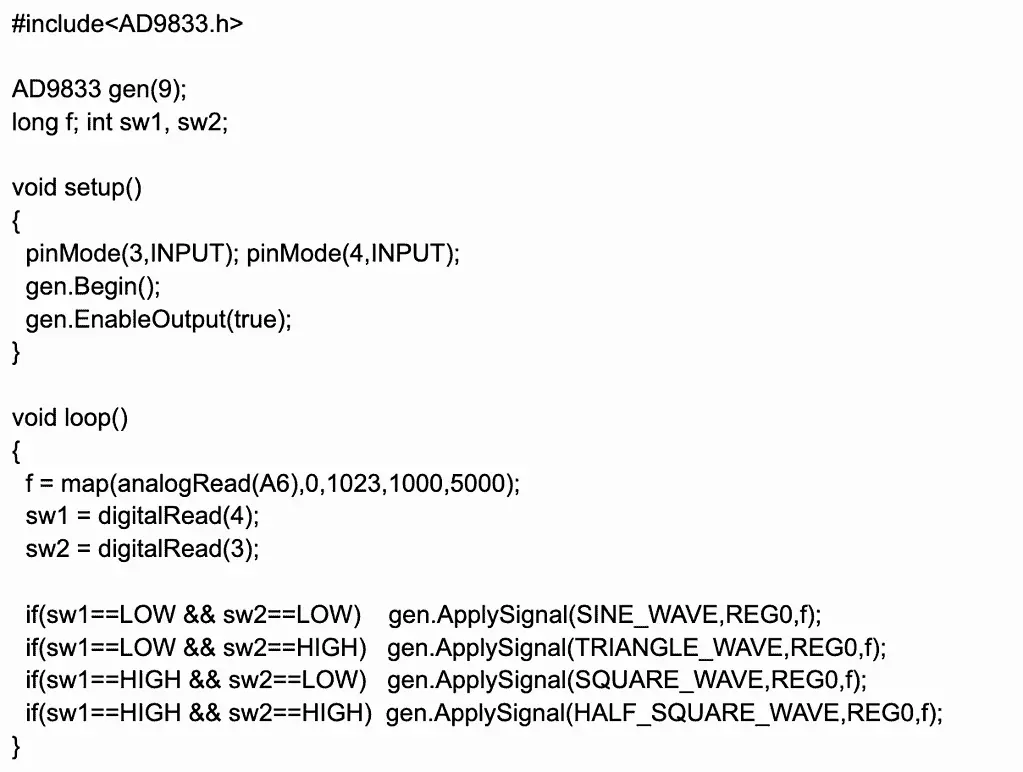
Remember to download the AD9833 library first to avoid errors in your code.
What The Code Does
After including the AD9833 library, we create an AD9833 object and initialize it to pin 9 for chip selection.
In the setup function, we instruct the Arduino IDE to set pins 3 and 4 as inputs to read data from them.
Also, we use the AD9833 object to begin communications with the module and set the initialized pin as an output.
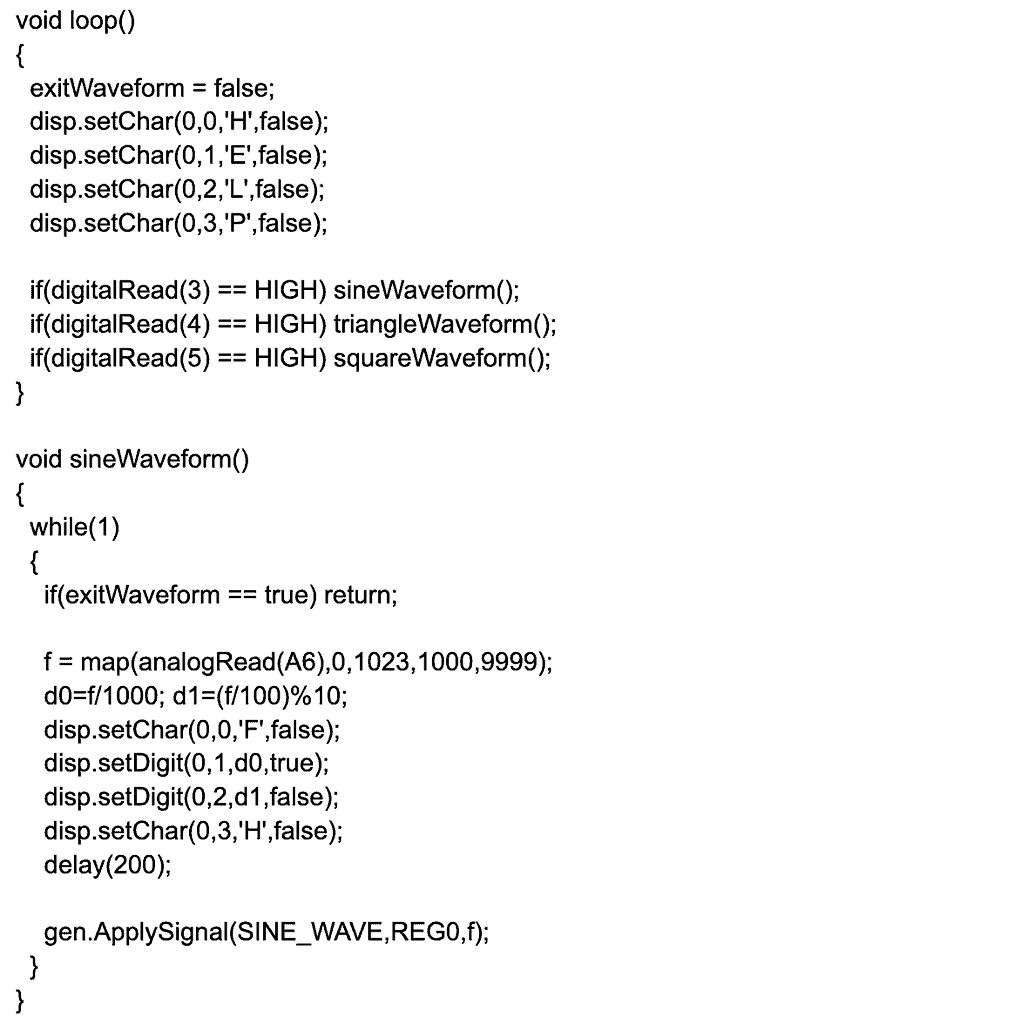
The loop function handles the program’s core logic, starting by reading the potentiometer analog output voltage.
Analog read () converts the signal to a digital one, resulting in values between 0 and 1023.
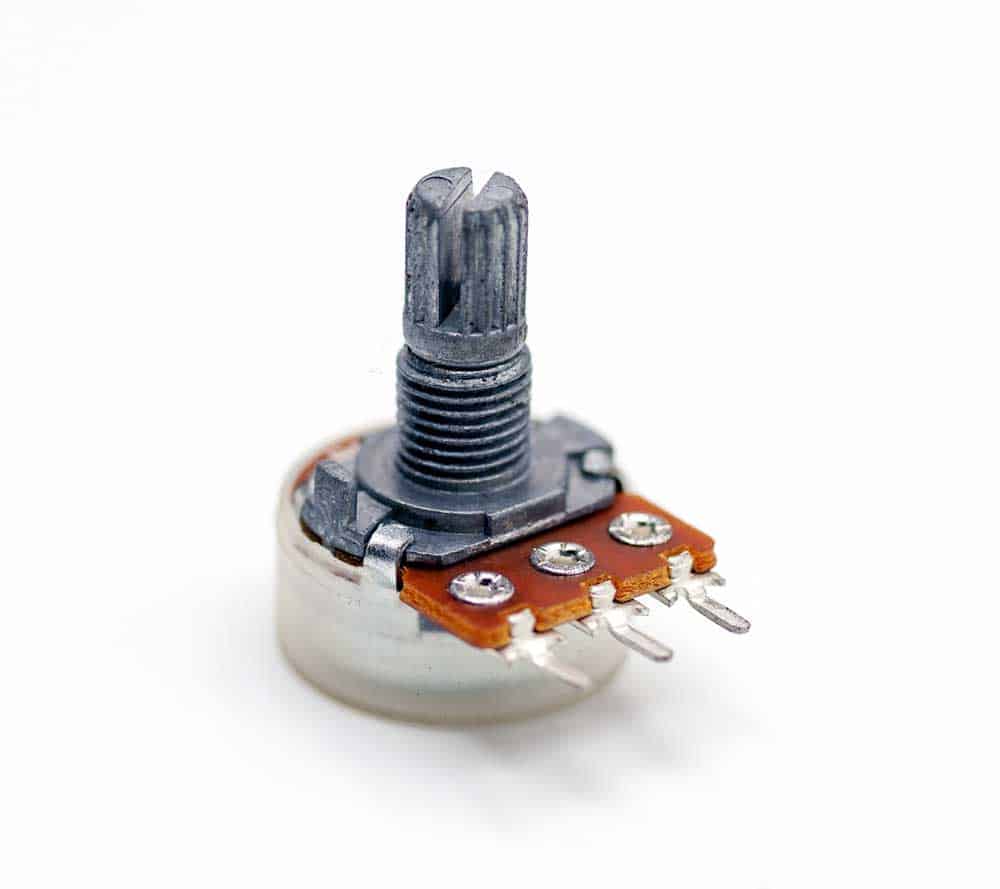
A potentiometer/variable resistor
The map function translates these values to outputs between 1000 and 5000, then stores the value in the long f variable.
These values form the generator’s frequency range. Remember, it goes up to 12.5 MHz.
After that, the integer variables sw1 and sw2 store the inputs from the 2-bit dip switch.
They get the values from reading the digital signal inputs from pins D3 and D4, which are either 1 or 0.
Using the truth table above, we set the code to apply a sine wave to the AD9833 object at the frequency mapped earlier.
The multiple if statements inside the void loop function accommodate all the possible inputs from the 2-bit dip switch.
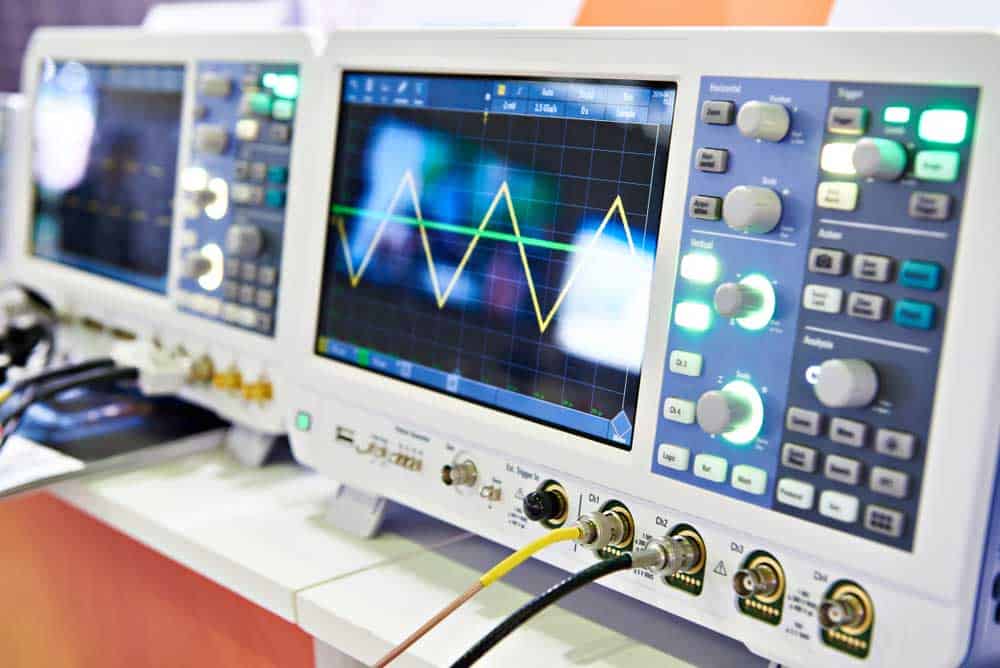
An oscilloscope displaying triangular waves
Arduino Waveform Generator Improvement
Let’s try to switch things up a little; make tiny improvements to the generator’s design.
Instead of using a 2-bit dip switch, let’s use push buttons.
And in addition to the oscilloscope, let’s add a four-character/digit, seven-segment display.
You’ll need a MAX7219 driver to control the external display.
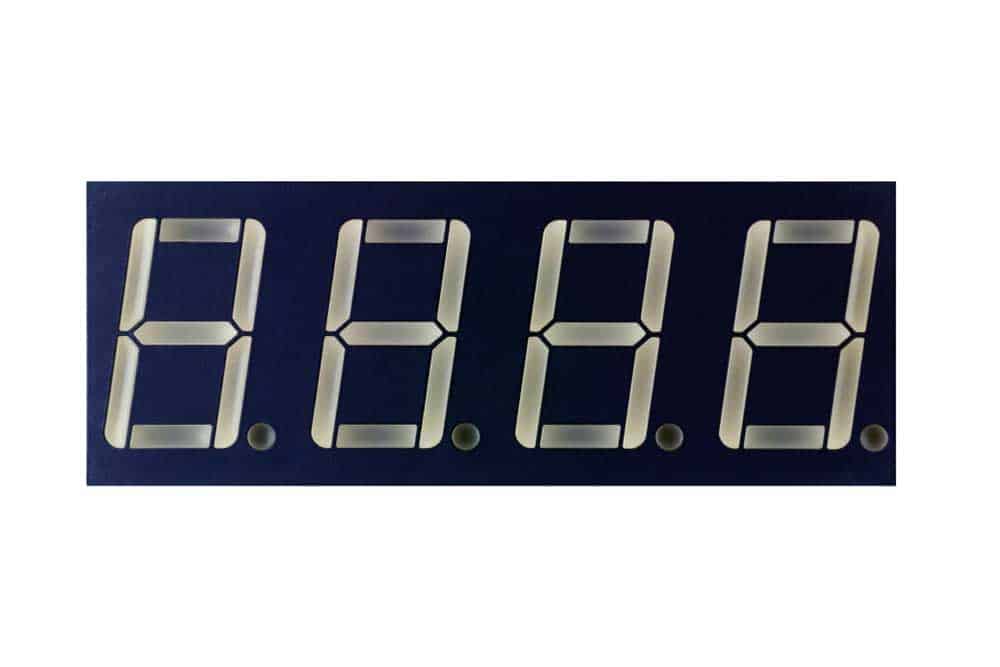
A four-digit, seven-segment display
Hardware Connections
| Arduino Nano | AD9833 |
| 5V | Vcc |
| GND | DGND |
| D11 | SDATA |
| D13 | SCLK |
| D10 | FSYNC |
Maintain the AD9833 module’s OUT and AGND pin connections with the Oscilloscope.
| Arduino Nano | MAX7219 |
| D8 | Din |
| D7 | CLK |
| D6 | LOAD |
| 5V | Vcc |
| 5V | ISET (via 10K resistor) |
| GND | GND |
Circuit Diagram
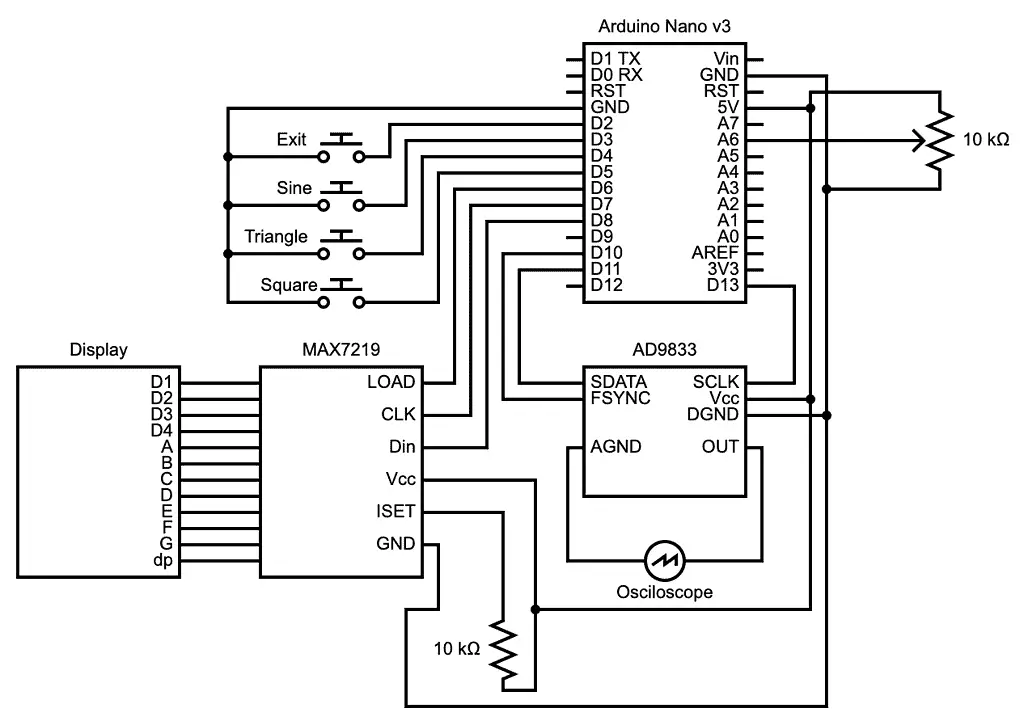
An advanced Arduino waveform generator circuit diagram
The display driver serially interfaces with the Arduino board using the three digital pins: Load, CLK, and Din.
Next to these are the four push buttons that connect to D2-D5.
Three of these set the waveform to show on the external display in KHz.
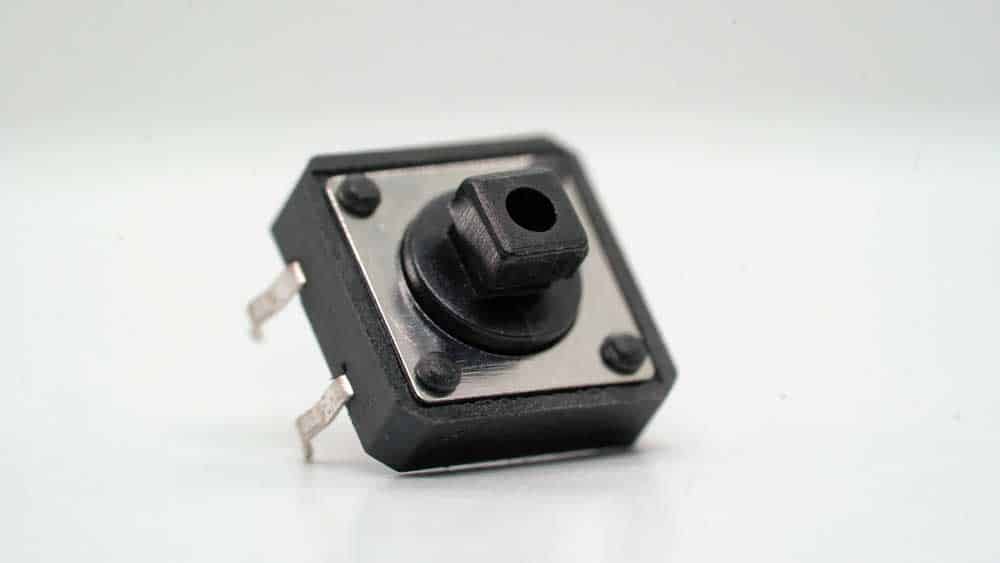
A close-up image of a push button
The fourth one (exit) connects to the interrupt pin D2 to end the displaying of the waveform selected earlier.
After exiting, the display will show the main menu title.
Here’s how to translate this logic into Arduino code.
Code
What The Code Does
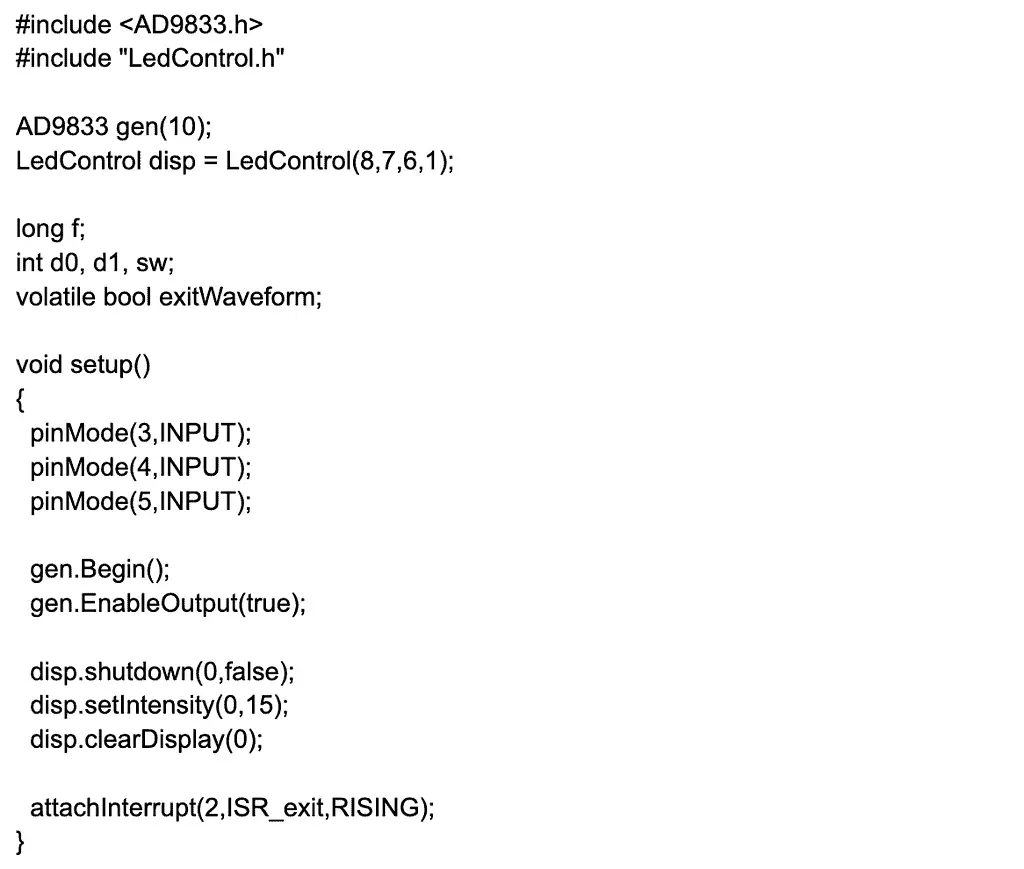
We had already included the AD9833 library above, so you only have to add the LED control library to run the MAX7219 display driver.
Since we moved the waveform generator’s FSYNC connection pin to D10, we’ll initialize its object using this number.
Next, we’ll create the display object using the digital Arduino pins connected to its serial line.
The object declaration has four parameters because it takes these arguments.
LedControl disp = LedControl(dataPin, clockPin, cs/loadPin, number_of_device);
By the number of devices, we mean the number of MAX7219 display drivers connected to the Arduino board.
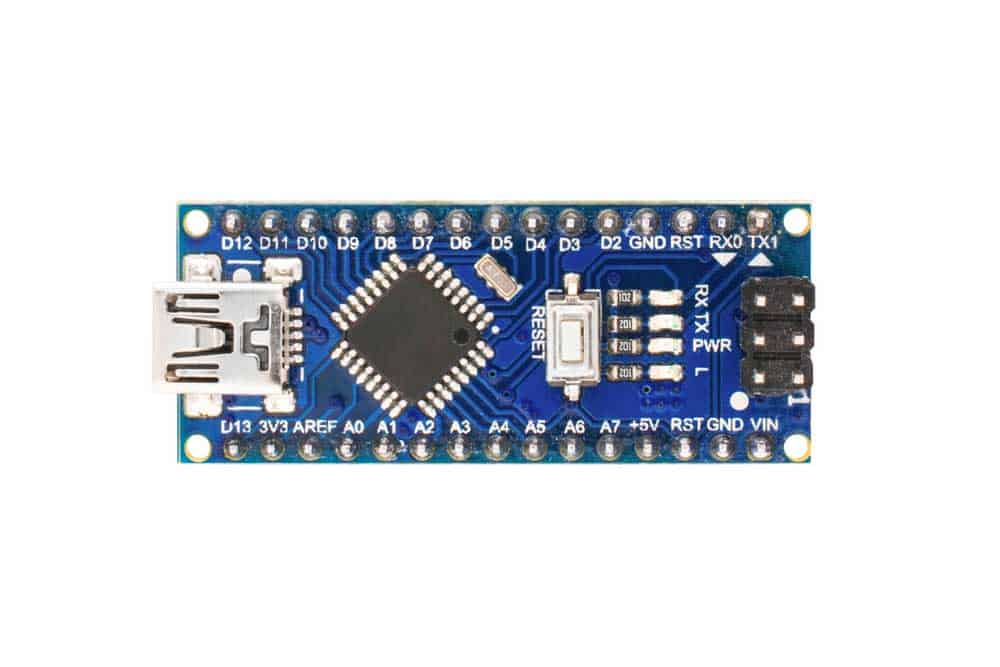
A Nano board (note the pins)
After that, we declare pins 3, 4, and 5 as inputs in the void setup function.
Also, we initialize the waveform generator and display (via its driver) by setting its intensity and clearing the screen.
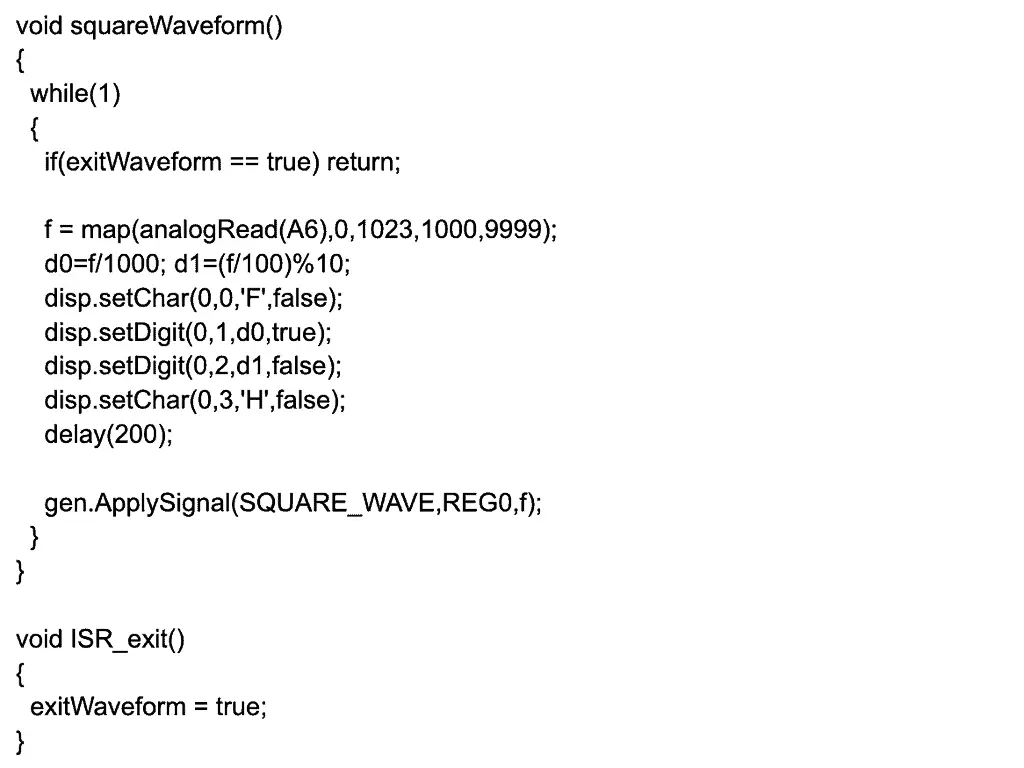
The last line in this function initializes what the exit button should do when pressed using the “Attach Interrupt” function.
It takes three parameters, the first being the digital pin the exit button uses to connect to the Arduino board. In this case, it is D2 (2 in the code).
The second parameter is the ISR function declared at the end, which sets the waveform variable to true.
Lastly, the “RISING” parameter indicates the function should activate when the pin voltage/logic state goes from low to high.
Void Loop Function
The purpose of this section is to listen for any input from the three buttons using the three if statements.
If any button-connected digital pin equals a logic high, the if statement will call the respective function.
Here’s what the button functions do.
A critical thing to note is the false exitWaveform boolean variable set at the beginning.
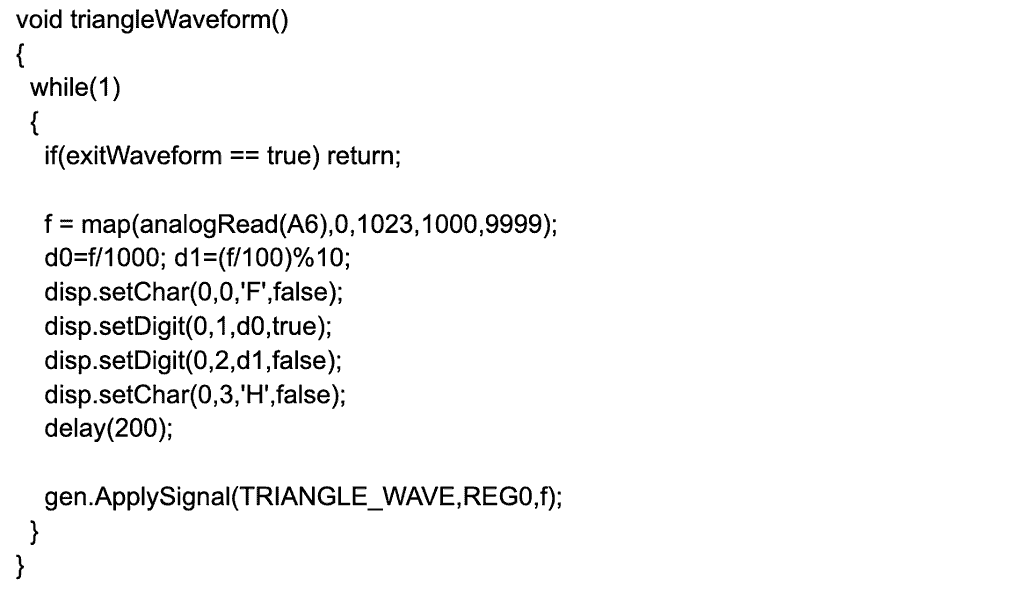
Button-Press Functions
These functions are similar to each other.
Each has the code inside a while loop to keep the waveform display continuous.
The code can only exit the loop if you press the exit button.
This action converts the exitWaveform boolean variable to true, returning the program to the primary loop function.
So the function will run continuously, mapping the analog input read from the potentiometer to values between 1000 and 9999.
After that, the division calculates the first number in the frequency value by dividing by 1000.
This number goes before the decimal point in the display.
The second division gets the remainder of the mapped frequency digit/100 when divided by 10 using the modulus operator.
This remainder gets displayed as the digit after the decimal point.
The code also displays F before and H after these calculated values.
It then waits for two microseconds before sending the data to the oscilloscope to display the respective waveform.
Wrap Up
Waveform generators have multiple technical applications, and you can build one using an Arduino board using the steps shown above.
The project is doable even by beginners, but make sure you import the required libraries into the Arduino IDE first.
And if you encounter any issues, contact us for troubleshooting or further assistance.